|
|
Win/Loss/Push Data
 How
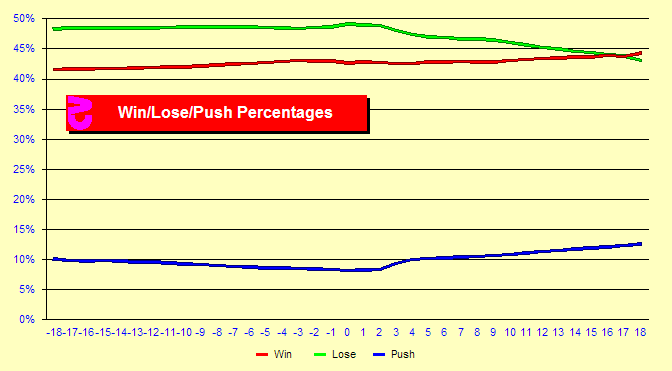
does the count affect win/lose/push rates? How
does the count affect win/lose/push rates?
There is a common misconception that you win many more hands at
higher counts. Unfortunately this is not true. This chart displays
the percentage of hands won, lost and pushed at each count. The
win percentage, in red, does slightly increase. However, it only
increases from 41.6% of hands at a true count of -18, to 42.7% at
TC zero to about 44% at TC +18. The percentage of hands lost does
decrease somewhat at the higher card counts. Most of this is offset
by an increase in pushes. Much of the increase in pushes is due
to an increase in player and dealer twenties due to the excess tens
in the shoe. Note that there are very few hands at the high counts.
|
|
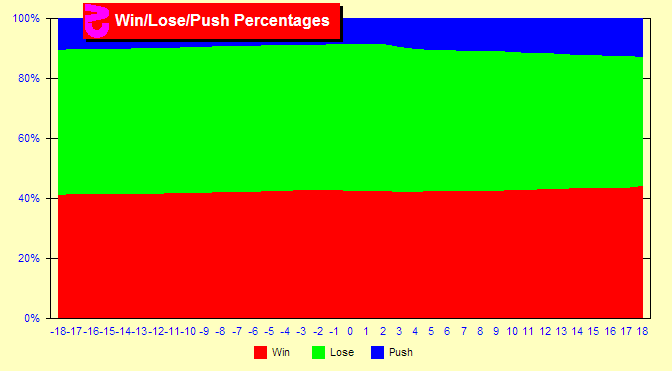
 Another
view of WLP by card count. Another
view of WLP by card count.
This is just another view of the same data in a 100% chart. Wins,
losses and pushes are stacked and add to 100%. Win/lose/push rate
is not the primary cause of the gain in advantage at higher counts.
The next page will further discuss the reasons we win more at higher
counts. |
|
Sim details
- Six decks, S17, DAS, LS, 4.81/6, Hi-Lo max indexes, trunc, half-deck
| |
|
|
 How
does the count affect win/lose/push rates?
 Another
view of WLP by card count.